Facts & Figures
Graduates
a) Number of Graduates of Undergraduate Programmes 2023/24
| School | Number |
|---|---|
| Business | 732 |
| Communication | 126 |
| Decision Sciences | 343 |
| Humanities and Social Science | 167 |
| Translation and Foreign Languages | 31 |
| Total | 1,399 |
b) Cumulative Number of Graduates: 26,204
c) Employment Status of Undergraduate Students 2022/23
| Employed | 80% |
| Further Studies | 9% |
| Others | 11% |
(% distribution based on Graduate Employment Survey as of April 2024)
d) Employment Industries of Full-time Employed Graduates of Undergraduate Programmes 2022/23
| Employment Industries | % |
|---|---|
| Accounting, Auditing and Business Services | 17.1% |
| Banking, Finance and Insurance | 15.9% |
| Trading, Wholesale and Retails | 8.7% |
| Communication and Media | 7.8% |
| Information Technology | 7.8% |
| Education | 7.2% |
| Transport and Logistics | 6.4% |
| Community and Social Services | 5.0% |
| Hospitality and Tourism | 4.1% |
| Government | 2.5% |
| Real Estate | 1.8% |
| Human Resources | 1.5% |
| Manufacturing | 1.2% |
| Medical / Health Services | 1.2% |
| Telecommunication | 0.8% |
| Others | 11% |
(% distribution based on Graduate Employment Survey as of April 2024)
a) Number of Graduates of Undergraduate Class 2021

b) Total Number of Graduates

c) Graduate Employment of Class 2021

d) Employment Industries of Full-time Employed Graduates of Undergraduate Class 2021

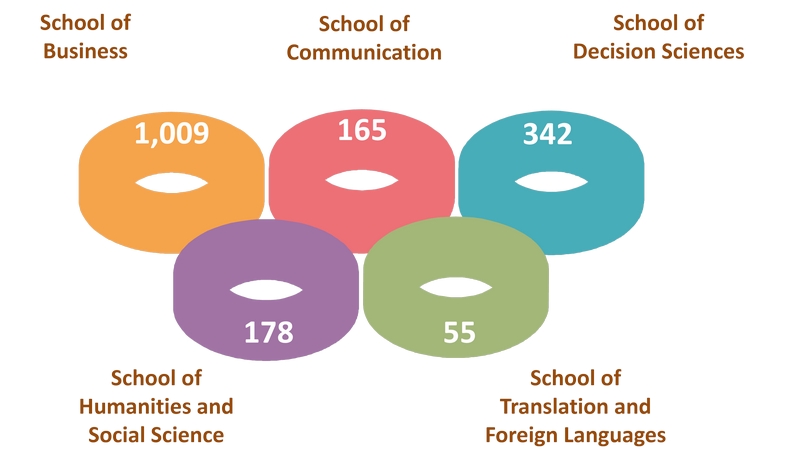
a) Number of Graduates of Undergraduate Class 2021
| School | Number |
|---|---|
| Business | 1,009 |
| Communication | 165 |
| Decision Sciences | 342 |
| Humanities and Social Science | 178 |
| Translation and Foreign Languages | 55 |
| Total | 1,749 |
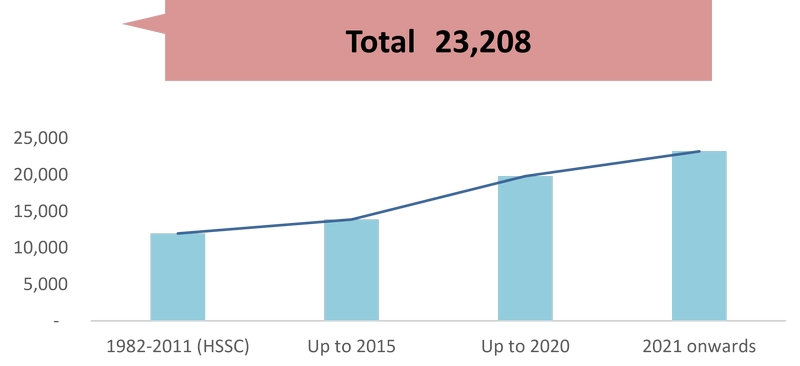
b) Total Number of Graduates: 23,208
| Year | Number |
|---|---|
| 1982-2011 (HSSC) | 11,952 |
| Up to 2015 | 13,868 |
| Up to 2020 | 19,817 |
| 2021 onwards | 23,208 |
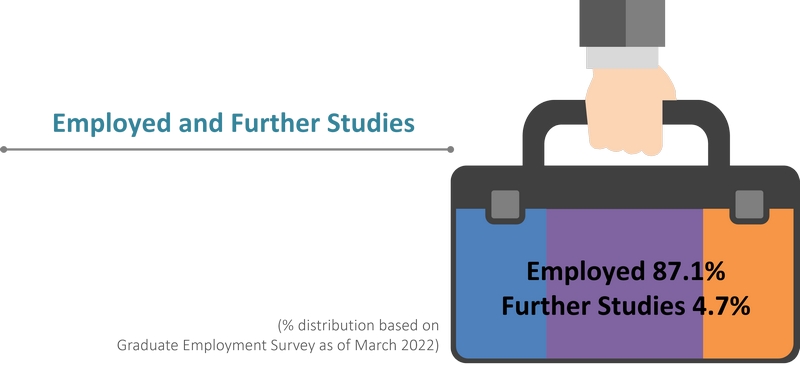
c) Graduate Employment of Undergraduate Class 2021
| Employed | 87.1% |
| Further Studies | 4.7% |
(% distribution based on Graduate Employment Survey as of March 2022)
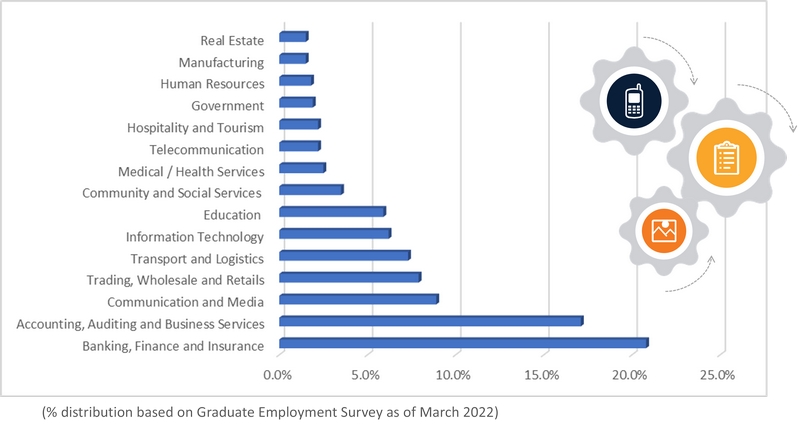
d) Employment Industries of Full-time Employed Graduates of Undergraduate Class 2021
| Employment Industries | % |
|---|---|
| Banking, Finance and Insurance | 20.8% |
| Accounting, Auditing and Business Services | 17.1% |
| Communication and Media | 8.9% |
| Trading, Wholesale and Retails | 7.9% |
| Transport and Logistics | 7.3% |
| Information Technology | 6.2% |
| Education | 5.9% |
| Community and Social Services | 3.5% |
| Medical / Health Services | 2.5% |
| Telecommunication | 2.2% |
| Hospitality and Tourism | 2.2% |
| Government | 1.9% |
| Human Resources | 1.8% |
| Manufacturing | 1.5% |
| Real Estate | 1.5% |
(% distribution based on Graduate Employment Survey as of March 2022)
